The Sieve Never Lies: How a Simple Stack of Mesh Became the Lab’s Ultimate Truth-Teller
May 25, 2026
The Moment the Stack Stops Shaking
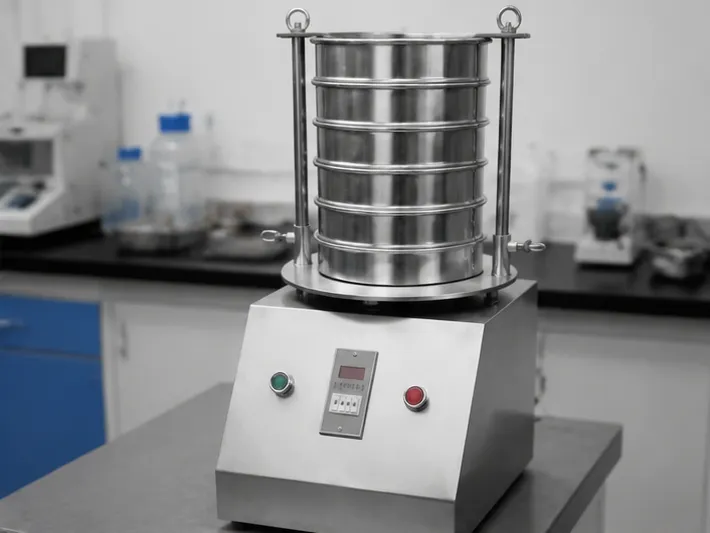
The machine goes silent. The high-frequency whine of the vibratory sieve shaker fades, and a technician approaches the stainless-steel column. Inside, a material that once looked like a uniform powder has now confessed its truth.
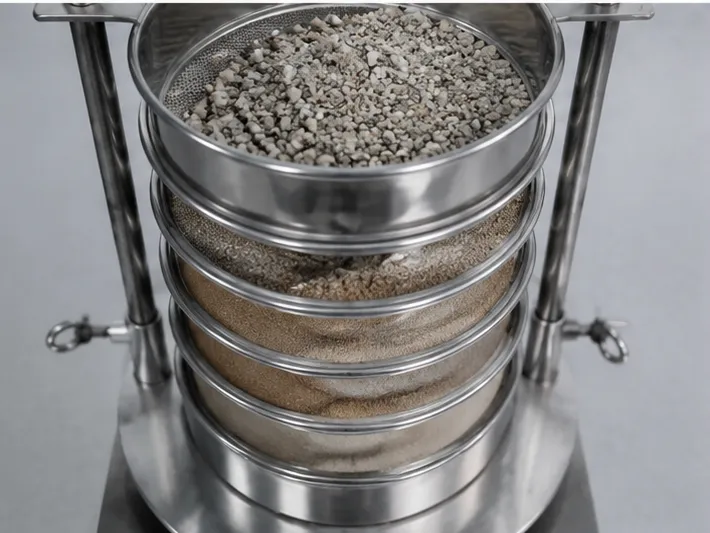
It has separated. Stratified.
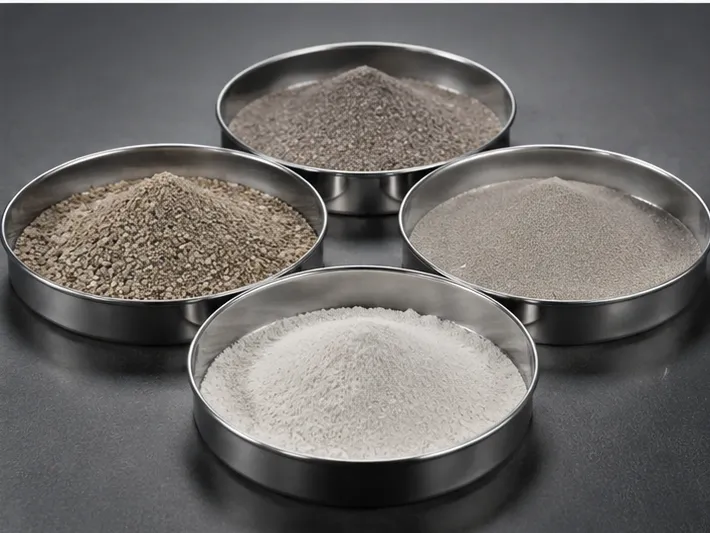
On the top sieve rests the coarse fraction—particles that resisted the relentless energy. On the bottom pan, a fine dust invisible to the naked eye moments ago. Every layer in between tells a story. The technician weighs each fraction, plots a curve, and in five minutes understands more about the material’s fundamental character than a microscope could reveal in an hour.
This is the quiet power of mechanical segregation. It does not guess. It sorts, weighs, and quantifies.
Beyond “Fine” and “Coarse”: Why We Measure What We Cannot See
There is a dangerous word in materials science: fine. It means nothing.
One engineer’s “fine powder” is another’s unprocessable grit. Optical illusions plague the bench top. A ground material looks uniform to the human eye—smooth, consistent, ready for the next stage. But the eye lacks resolution. It cannot distinguish 40 micrometers from 80. It certainly cannot detect a broad distribution hiding behind a deceptively average particle size.
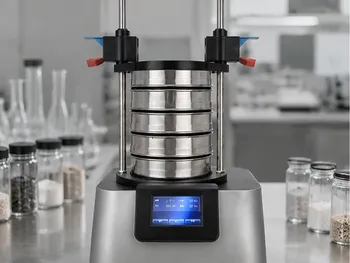
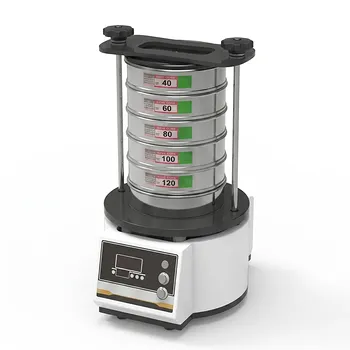
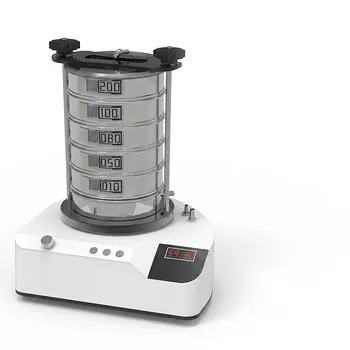
Vibratory sieve shakers eliminate the semantic ambiguity. By physically driving a sample through a vertical stack of standard test sieves with progressively smaller apertures—say, from 2.36 millimeters down to 0.075 millimeters—the system forces the material to declare its true size categories. The operator then weighs the residue on each layer.
What emerges is a mass distribution. A curve. A fingerprint.
A steep curve shouts: This material is tightly graded. The process is in control. A shallow, stretched-out curve whispers something else entirely: Inconsistency lives here.
How the Energy of Vibration Becomes Data
The Physics of a Single Particle’s Journey
A particle sits on a mesh. The aperture is slightly larger than the particle’s diameter—theoretically, it should slip through instantly. In practice, it does not.
Particles clump. Electrostatic forces glue fines to coarse fragments. Irregular shapes wedge themselves against the wires. A static pile of powder on a screen achieves almost nothing.
Enter mechanical vibration. A vibratory sieve shaker imposes controlled kinetic energy on the entire column. The motion is typically three-dimensional—vertical oscillation combined with a horizontal swirling action. This does two things:
- It fluidizes the sample bed, breaking apart soft agglomerates.
- It continuously reorients particles, presenting them to the apertures from every possible angle.
A needle-like particle might lie flat and fail to pass. Reoriented vertically by vibration? It slides through. A fine particle trapped under a larger brother? The sharp acceleration of the sieve deck frees it.
The Sieve Itself as a Calibrated Gate
The sieves in the stack are not arbitrary screens. Standard test sieves are manufactured to stringent international specifications—ASTM E11 or ISO 3310-1. The wire mesh openings are inspected optically. The tension of the mesh across the frame is controlled.
This standardization is the invisible scaffold of global commerce. When a specification demands “100% passing 75 microns,” that threshold is physically embodied in a specific piece of woven wire mesh sitting in a lab in Stuttgart, or Osaka, or Houston. The sieve is the standard, and the shaker is the enforcement mechanism.
Reading the Statistical Confession of a Powder
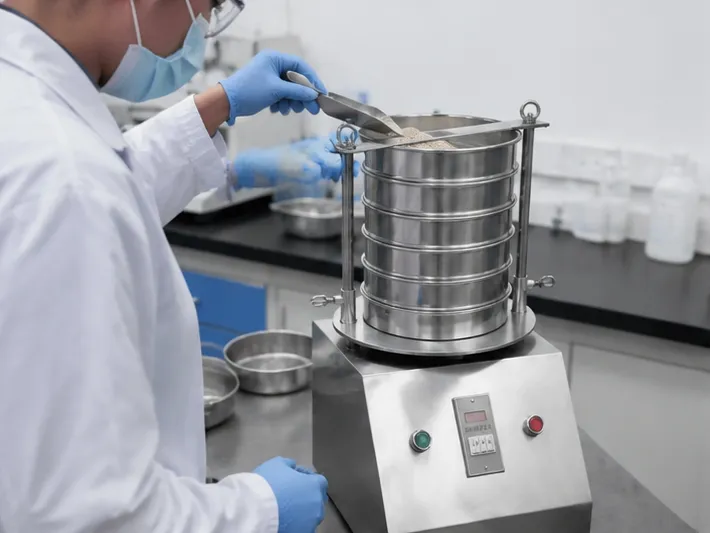
Once the shaker stops, the real analysis begins. A technician weighs the residue retained on each sieve and the final pan. These masses are converted to percentages of the total sample.
The data then undergoes a transformation into a cumulative particle size distribution curve. The x-axis represents particle diameter (logarithmic, descending with the sieve stack). The y-axis represents the cumulative mass percentage passing.
The Shape of the Curve Is the Shape of Your Process
A perfectly uniform material—in theory—would produce a vertical line. All particles exist at a single size. Reality produces sigmoidal curves. The question is how steeply they rise.
- A steep slope over a narrow size range: Your grinding or granulation process is precise. Energy input is well-controlled.
- A gradual slope spanning an order of magnitude: Your process is producing a wide distribution. This may be intentional in applications requiring high packing density, or a sign of inconsistent milling.
The curve translates physical morphology into a visual logic. Technicians do not need to imagine the consistency of a powder; they can look at the curve and see the spread.
Two Numbers That Define Everything: GMD and GSD
For deeper quantification, the raw sieve data yields two statistical metrics:
Geometric Mean Diameter (GMD) calculates the central tendency of the distribution on a logarithmic scale. It answers: On average, how large are these particles?
Geometric Standard Deviation (GSD) measures the spread around that mean. A GSD of 1.0 would indicate a perfectly monodisperse sample. A GSD of 2.0 or 3.0 reveals a broad, polydisperse distribution.
These two numbers provide a mathematical basis for process control. If a technician adjusts the rotor speed on a mill and the GSD tightens from 2.4 to 1.8, the improvement is quantifiable. No arguments. No subjective “it looks finer.” Just the sieve data, balancing the scales.
Where the Sieve Analysis Cracks Open Research Problems
The Hidden Variable in Kinetic Studies
Consider a laboratory running adsorption experiments. They are testing a novel biosorbent material to remove heavy metals from water. The protocol calls for a known mass of sorbent, agitated with a contaminant solution for a set time. The researchers measure the final concentration and calculate uptake capacity.
There is a hidden variable. Particle size.
If the sorbent particles range wildly—from 20 to 200 micrometers—diffusion pathways vary enormously. A small particle saturates quickly; a large one is still equilibrating when the experiment ends. The computed “average” capacity is an artifact of the size distribution, not the material’s intrinsic chemistry.
By using a vibratory sieve shaker to isolate a tight range—say, 63 to 90 micrometers—researchers eliminate this diffusion resistance variable. The kinetics data then reflects only the chemistry. The GSD collapses. The scientific validity solidifies. Reproducibility becomes possible.
The Granulation Feedback Loop
In powder metallurgy or ceramic processing, granulation is a critical step. Fine powders must be agglomerated into free-flowing granules for consistent die filling. The granulation process involves spraying a binder onto a moving powder bed—an intricate dance of liquid bridges and drying rates.
Too much binder? Large, hard agglomerates form. Too little? Fines remain, causing segregation during pressing and density gradients in the final part.
The sieve stack becomes the feedback sensor. A sample of granules is sieved. The target specification might be: “95% between 150 and 500 micrometers, with less than 2% finer than 45 micrometers.” If the sieving reveals a bimodal distribution—a spike of coarse granules and a spike of fines—the granulator parameters are wrong. The liquid-to-solid ratio needs adjustment. The mixing speed may be off.
The technician tweaks a setting, runs the granulator for another batch, and sieves again. The curve shifts into specification. The process is optimized based on physical evidence.
When the Sieve Stops Working: The Limits of Mechanical Truth
Vibratory sieve shakers are powerful, but they are not universal solutions. They possess a specific set of failure modes that demand engineering awareness.
The Shape Problem
Sieve analysis operates on a geometric assumption: particles are equant, roughly spherical. The apertures in a woven wire mesh are square. A particle passes when two of its three dimensions fit within that square.
Now consider a needle-shaped mineral crystal. It might be 5 micrometers thick and 200 micrometers long. It can pass end-on through an aperture far smaller than its “true” hydrodynamic diameter. The sieve records it as small, but in a fluidized bed reactor, it behaves as a large, high-aspect-ratio object. The data lies.
Similarly, flat, platy particles—like clay minerals or flaky metal powders—orient themselves across the mesh and refuse to pass, reporting as coarser than they functionally are. The sieve curve shifts to the right for reasons of morphology, not mass.
The Fines Threshold
Below approximately 20 to 30 micrometers, dry mechanical sieving enters a realm of diminishing returns. The forces that dominate at this scale are no longer gravitational and inertial; they are electrostatic and van der Waals. Particles stick to each other. They stick to the wire. They stick to the frame.
This is sieving blinding—an invisible skin of fine powder coating the mesh, effectively shrinking the apertures and trapping material that should pass. Aggressive vibration can compound the problem, compacting the fines into a tenacious layer.
Solutions exist. Air-jet sieve shakers use a rotating slot nozzle beneath the sieve to blow particles upward, continuously cleaning the mesh with a curtain of air. Wet sieving suspends the powder in a liquid medium, neutralizing electrostatic charges. But the core limitation remains: ultra-fine distributions often require complementary techniques like laser diffraction.
Integrating Sieve Analysis into a Complete Preparation Workflow
Sieving does not exist in isolation. The uniformity it measures is the direct result of preceding steps—crushing, grinding, mixing—and the foundation for subsequent steps—pressing, sintering, or chemical reaction.
Before the Sieve: Grinding with Intent
A jaw crusher reduces coarse feed to a manageable size. A planetary ball mill grinds brittle materials to the micrometer scale through impact and friction. A jet mill uses high-velocity gas collisions to produce ultra-fine powders with narrow distributions.
The sieve shaker judges the output of these machines. If the mill is worn—if the grinding media have lost mass or the liner is grooved—the sieving curve will drift. More coarse residue appears on the top screen. The technician sees the shift and schedules maintenance. The sieve acts as a process health monitor.
After the Sieve: Consolidation into Solid Form
Once a powder’s uniformity is verified, it flows toward consolidation. Hydraulic presses compact the granular material into dense, handleable shapes for further processing or final use. The pressing behavior—how the particles rearrange and fracture under load—is entirely dependent on the size distribution just confirmed by the sieve.
A broad distribution packs more densely because fines fill the interstitial voids between coarse particles. A narrow distribution produces uniform pore channels after compaction. The XRF pellet press relies on consistent particle size to produce a flat, homogeneous surface for spectroscopic analysis. Any variation in raw powder translates directly to analytical error.
The CIP/WIP Dimension
For complex shapes or ultra-high uniformity in three dimensions, Cold Isostatic Pressing (CIP) applies pressure via a fluid medium, compacting powder from all directions simultaneously. This process is exquisitely sensitive to packing uniformity. If the size distribution varies within the mold—if coarse particles have segregated from fines during filling—the isostatic pressure will produce differential densification. The compact will warp during sintering.
Sieving data offers insurance. By verifying the PSD before filling the CIP mold, operators confirm that the powder has not segregated during storage or transport. The isostatic press then delivers its full capability of uniform density.
Choosing Your Sieving Strategy
Not every application demands the same sieving approach. The technology must align with the material’s physical character and the data’s ultimate purpose.
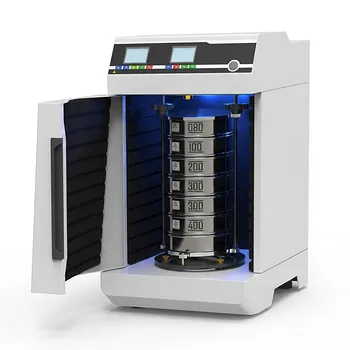
- For Quality Control of Dry Powders: A vibratory sieve shaker with a standard stack monitors residue percentages against established limits. The 850-micrometer or 75-micrometer threshold becomes a pass/fail gate.
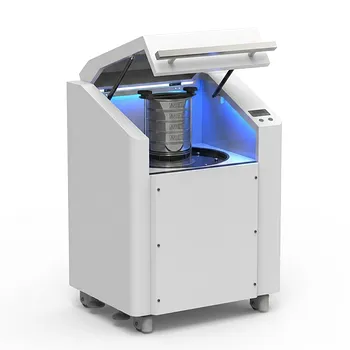
- For Materials Prone to Static or Blinding: An air-jet sieve shaker, employing a rotating air stream to de-agglomerate and clean the mesh, provides accurate results for fine, cohesive powders down to 20 micrometers.
- For High-Precision R&D: Combining sieving with statistical analysis—calculating GMD and GSD—transforms the shaker from a sorting device into a research instrument capable of detecting subtle batch-to-batch variations.
- For Soil Classification and Geotechnical Work: A full sieve stack, potentially augmented by a wet-washing stage for the fines fraction, establishes the sand-silt-clay proportions critical for engineering classification.
The commitment is the same: to replace human judgment with mechanical and mathematical rigor.
The Sieve Is a Witness
A vibratory sieve shaker is not a complex machine. A stack of sieves is fundamentally simple—mesh stretched across a frame, arranged in descending order. The sophistication lies in the application.
When the vibration stops and the fractions are weighed, the result is a dataset that transcends opinion. It is a profile of physical truth. It exposes the inefficiency of a worn mill, validates the reproducibility of a research protocol, and confirms the consistency of a production batch.
In a laboratory, data must be trusted. Instruments must be precise. The sieve shaker, paired with standard test sieves, earns that trust through direct mechanical interrogation. It separates not just particles, but fact from assumption. The curve on the graph is the material’s own declaration of its nature—indisputable, mathematical, and ready to guide the next step in the process.
From initial crushing through fine grinding, from mixing through isostatic pressing, the thread of uniformity runs through every stage. The sieve is the checkpoint. The validator. The quiet truth-teller on the bench. To learn how these analytical and preparation solutions can integrate into a complete material processing workflow, Contact Our Experts
Quick Links
Suggested Products
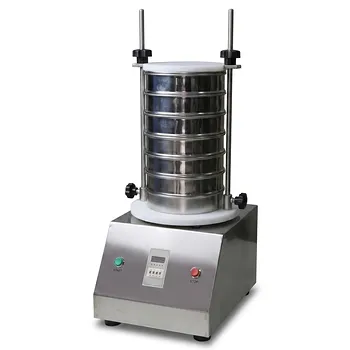
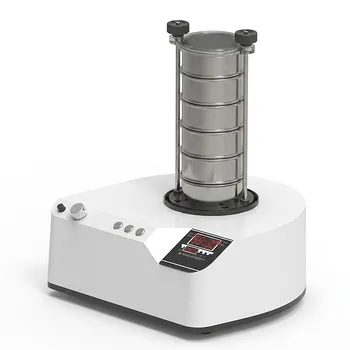
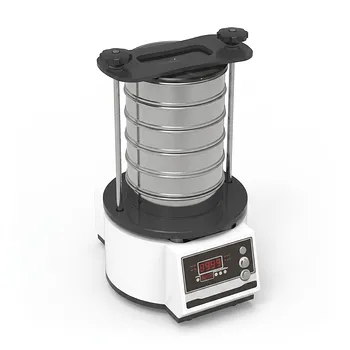
Stainless Steel Laboratory Vibratory Test Sieve Shaker Laboratory Vibratory Test Sieve Shaker for Precision Particle Size Analysis and Powder Grading Vibratory Sieve Shaker Electromagnetic 3D Motion Powder Particle Size Analyzer for Dry and Wet Sieving Small Laboratory Vibrating Sieve Shaker for Precise Particle Size Analysis Small Laboratory Vibratory Sieve Shaker for Powder Gradation and Particle Size AnalysisFurther Reading
The Hidden Economics of Particle Size: Why the Most Overlooked Variable in Material Science Controls Everything The Dance of Sharp Angles: Why the Chaos of a Vibrating Sieve Is the Only Thing That Makes Sense for Black Silicon Carbide The Quarter-Millimeter Margin: Why Vibratory Sieve Precision Determines Artificial Stone Profitability The Sieve That Sees the Future: How a Vibratory Shaker Predicts Ceramic Failure Before It Happens The Particle Whisperer: How a Vibratory Sieve Shaker Decodes Pine Bark into a Predictable Engineering MaterialPowderPreparation
Last updated on May 15, 2026
Related Products
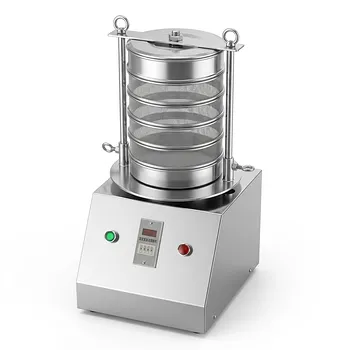
Stainless Steel Laboratory Vibratory Test Sieve Shaker
Laboratory Vibratory Test Sieve Shaker for Precision Particle Size Analysis and Powder Grading
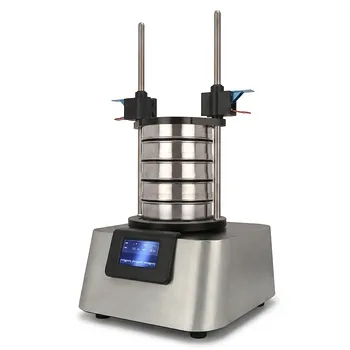
Vibratory Sieve Shaker Electromagnetic 3D Motion Powder Particle Size Analyzer for Dry and Wet Sieving
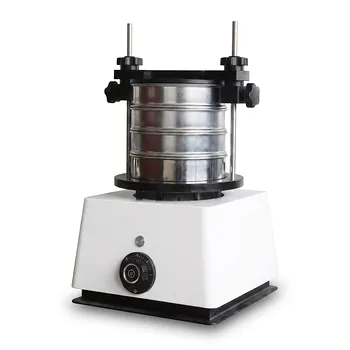
Small Laboratory Vibrating Sieve Shaker for Precise Particle Size Analysis
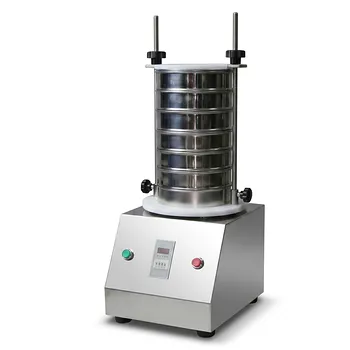
Small Laboratory Vibratory Sieve Shaker for Powder Gradation and Particle Size Analysis
Laboratory Dry and Wet Three Dimensional Vibratory Sieve Shaker for Particle Analysis
Dry Three Dimensional Vibratory Sieve Shaker
Heavy Duty Dry Three Dimensional Vibratory Sieve Shaker for Particle Separation

High Frequency Wet Three-Dimensional Vibrating Sieve Shaker for Dry and Wet Particle Size Analysis
High Frequency Cabinet Type Three-Dimensional Rotary Vibrating Sieve Shaker for Dry Sieving and Particle Classification
三维电磁微量振动筛分仪
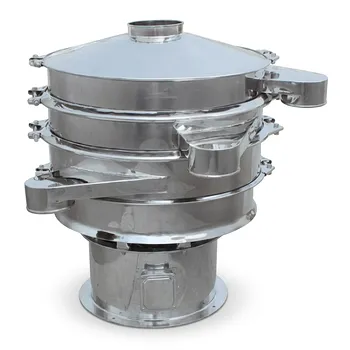
Stainless Steel Rotary Vibrating Sieve High Precision Circular Vibratory Separator Industrial Powder Grading Machine Multi Layer Sifting Equipment
Tapping Oscillating Sieve Shaker for Dry and Wet Particle Size Analysis
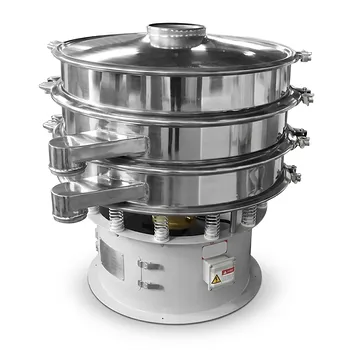
Three Dimensional Rotary Vibrating Sieve
Vibratory Superfine Grinder for Ultra Fine Laboratory Powder Milling
Automatic Vibrating Powder Feeder for Laboratory Material Processing Precision Vibratory Hopper Feeder for Granular and Powder Material Handling Industrial Grade Vibrating Tray Feeder for Consistent Material Sample Preparation
Vibratory Disc Mill for Rapid Fine Grinding and High Throughput Sample Preparation of Hard and Brittle Materials
Small Vibrating Ultrafine Grinder for Traditional Chinese Medicine