The Hidden Economics of Particle Size: Why the Most Overlooked Variable in Material Science Controls Everything
Jun 29, 2026
The powder that failed at noon
You wouldn't have noticed the difference by eye. The batch looked identical to yesterday's — same white powder, same weight on the scale. But by 2 p.m., the tablet press was rejecting 18% of compacts for low tensile strength. The line slowed, hoppers clogged, and somewhere inside a R&D report, a single variable had shifted without anyone ringing an alarm: particle size distribution.
Microcrystalline cellulose doesn't announce its variability. It hides it in the subtle drift of D50 by a few microns, in a tail of fines that wasn't there last week, in a uniformity coefficient that drifted from 4.1 to 2.7. The powder industry has a romantic habit of chasing big, visible problems — temperature, pressure, binder chemistry — while the quietest variable reshapes the economics underneath.
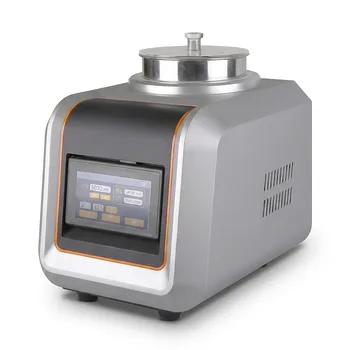
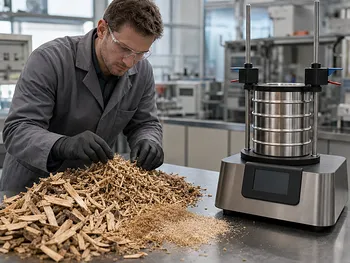
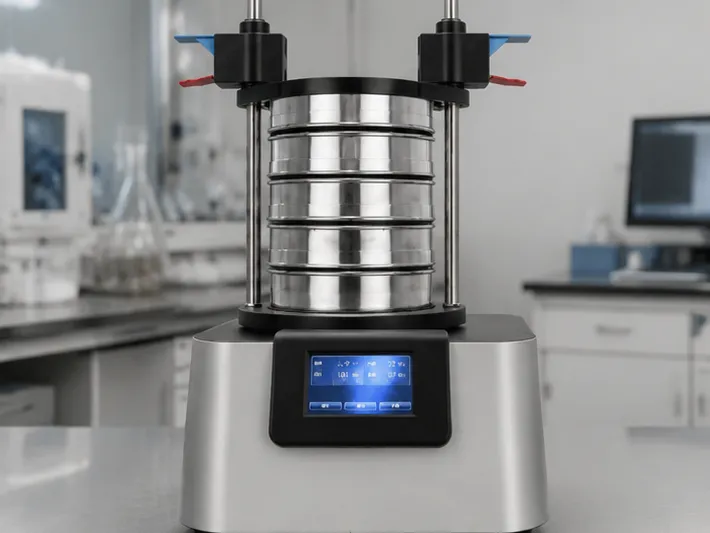
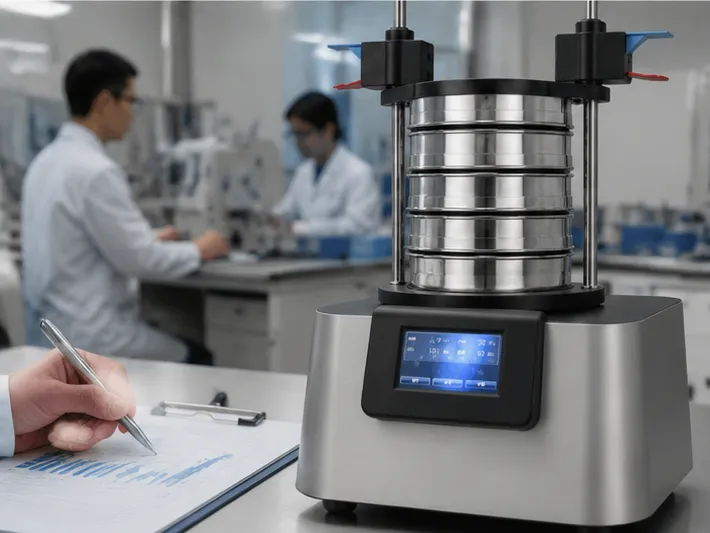
The vibratory sieve shaker exists to make that variable audible.
What we ignore when we look at powder
The illusion of sameness
Humans are poorly wired for powder. We see a uniform white mass and assume homogeneity. But a 50-micron granule is not a 100-micron granule — it's eight times smaller in volume, flows differently, compacts differently, absorbs liquid at a different rate. Our intuition fails at the microscale.
Morgan Housel often writes about the gap between what we can see and what actually matters. In material science, that gap is literally sub-millimeter. The particle size distribution is the financial statement of a powder — dense with information, boring to look at, and catastrophic when ignored.
The three numbers that govern your morning tablet
When you swallow a tablet, you're experiencing the endpoint of three rarely-mentioned metrics:
- D10, D50, D90: the particle diameters at 10%, 50%, and 90% of the cumulative distribution
- Uniformity coefficient (Cu): D60/D10 — how wide the size spread is
- Fineness modulus: one number summarizing the coarse-to-fine balance
These numbers predict whether the tablet holds together, whether the die fills consistently at 120 strokes per minute, and whether the dissolution profile matches the clinical trial. Change the numbers, change the drug.
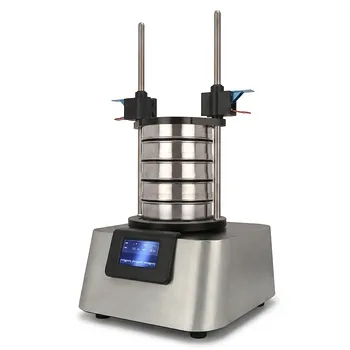
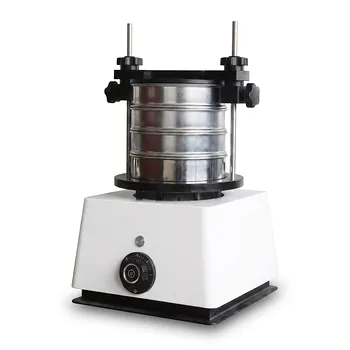
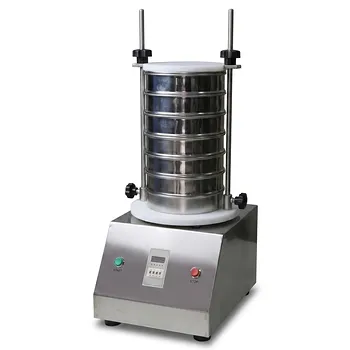
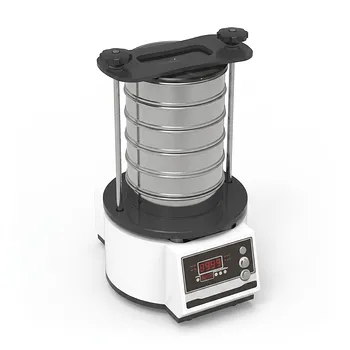
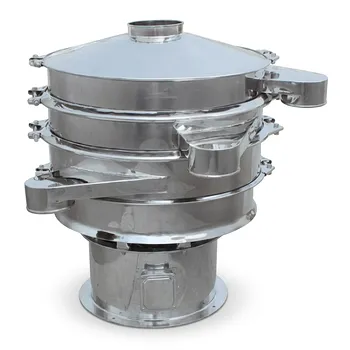
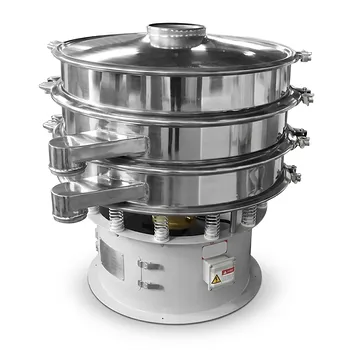
The vibratory sieve shaker as a truth-teller
It doesn't guess. It sorts.
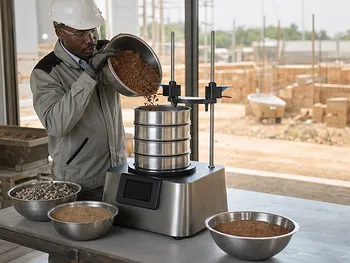
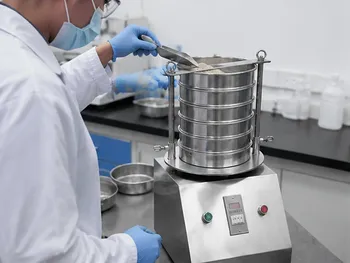
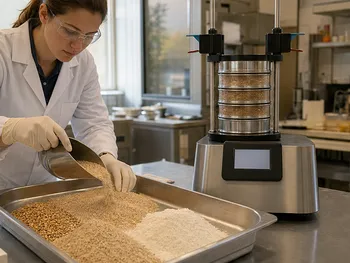
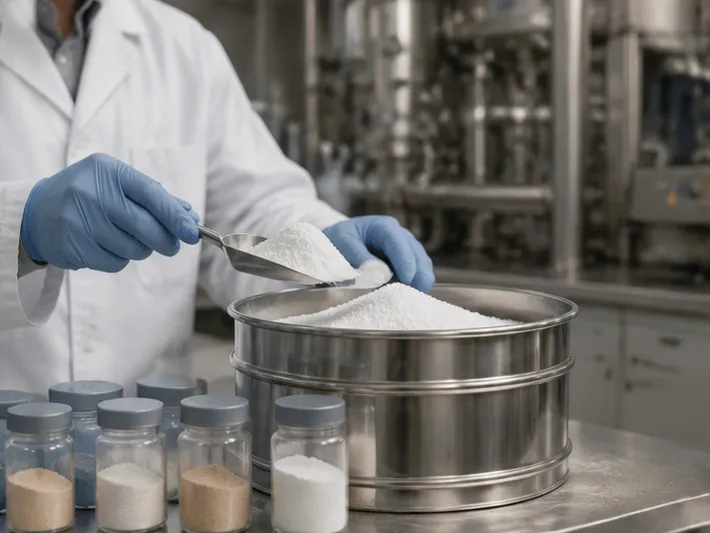
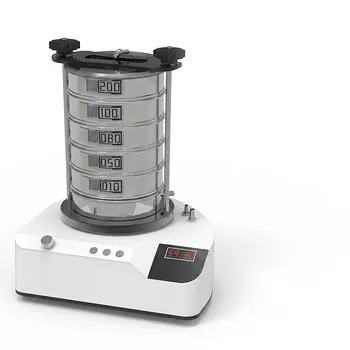
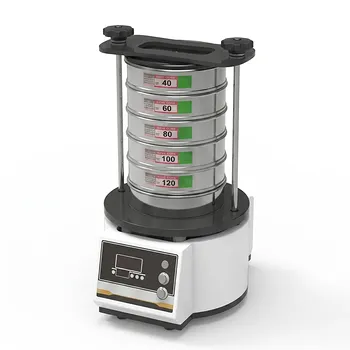
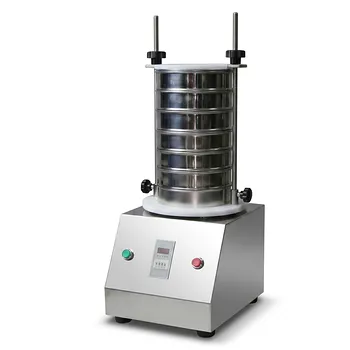
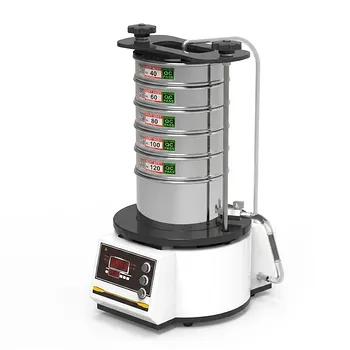
A vibratory sieve shaker is conceptually simple: a motor drives high-frequency, low-amplitude vibration through a stack of precision test sieves with descending aperture sizes. The sample moves across each mesh surface, and particles that can pass through, do. What remains on each sieve tells an uncompromising story.
Time doesn't lie when you weigh what's left behind.
The process delivers exactly the data that intuition cannot:
- Mass retained per sieve → frequency distribution curve
- Cumulative percentages → D10, D50, D90
- Shape of the curve → grinding process signature
- Percentage below 25μm → attrition warning
From data to decision
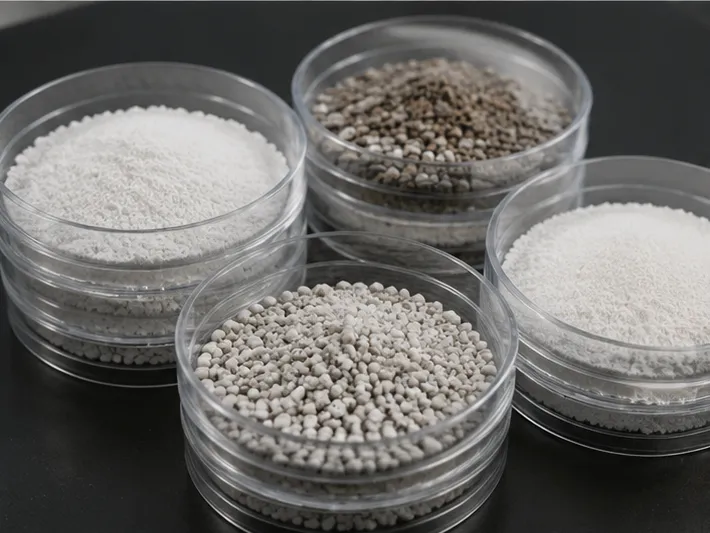
Researchers working with microcrystalline cellulose use this output to isolate specific size fractions — G1 (coarse), G2 (medium), G3 (fine) — and then test each independently for tensile strength, absorption kinetics, and bulk density. The conclusions are often surprising: the optimal fraction for compression isn't necessarily the one that flows best. Without the fractionation step, you would never know.
A vibratory sieve shaker transforms an unmeasurable suspicion into a controllable parameter. It doesn't improve your powder; it reveals what's already there — which is the first step to improving it.
Table: What the sieve shaker teaches you about your MCC
| Observation | What it signals | Manufacturing consequence |
|---|---|---|
| High mass on top coarse sieve | Incomplete milling or large agglomerates | Poor die fill, uneven tablet weight |
| Excessive fines (<25μm) | Over-milling or particle attrition | Flow stoppage, capping, dust |
| Narrow central peak | Tight process control | Consistent tensile strength, predictable dissolution |
| Bimodal distribution | Unintended segregation or blending defect | Content uniformity failure |
The psychology of process optimization
We measure what we can see
Heat and pressure have gauges. Particle size distribution has a labor-intensive, multi-sieve protocol. The bias is clear: engineers optimize what they can instrument easily. The sieve shaker bridges that gap, converting a physical separation into quantifiable metrics that can be trended, controlled, and — most critically — correlated with failure events.
The fine that broke the batch
A pharmaceutical plant once traced a 23% increase in tablet capping to a 1.8% increase in fines below 20μm. That's noise in most labs. But fines fill the interstitial spaces between larger granules, reducing void volume and trapping air during compression. The air expands on ejection and creates micro-cracks. The sieve shaker's mass distribution data made the invisible crack visible.
This is the Atul Gawande idea applied to powder: systems fail in the details, and details require deliberate, structured scrutiny. A checklist approach to particle characterization — including regular sieving, distribution plotting, and D-value trending — catches failure before it propagates downstream.
Beyond cellulose: the universal truth of powder processing
Materials are different. The need for size control is constant.
Ceramic powders for spark plugs, metal powders for additive manufacturing, battery cathode materials, pharmaceutical excipients — they all share one requirement: predictable packing, flow, and reactivity. And they all respond to the same fundamental law:
The history of the powder is written in its particle size distribution.
A vibratory sieve shaker is equally relevant whether your concern is:
- The sinterability of zirconia granules
- The tap density of lithium iron phosphate
- The cold isostatic pressing behavior of tungsten carbide
The full preparation chain
Sieving is a midpoint, not a starting line. To get meaningful, reproducible particle size data — and to produce powder worth measuring — you need a complete preparation ecosystem:
-
Crushing and grinding — Jaw crushers, planetary ball mills, jet mills, and rotor mills reduce raw materials to target size regimes. Liquid nitrogen cryogenic grinders handle temperature-sensitive or tough materials without introducing thermal artifacts.
-
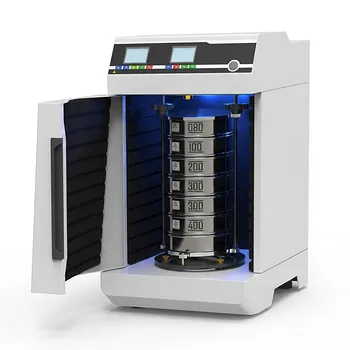
Sieving and classification — Vibratory and air-jet sieve shakers, equipped with certified test sieves and precision meshes, separate the milled product into measurable fractions. Air-jet models are especially valuable for materials prone to static-induced agglomeration — a common source of measurement error.
-
Mixing and defoaming — Powder mixers and defoaming mixers ensure that binders, lubricants, and active ingredients distribute uniformly. A perfectly sized particle that segregates in the hopper is no better than an unsized one.
-
Compaction and forming — Hydraulic presses (including cold and warm isostatic presses, XRF pellet presses, hot presses, and vacuum hot presses) finalize the geometry and density. Particle size data directly informs the press parameters that determine green strength, final porosity, and dimensional stability.
A well-characterized particle system is one where each stage leaves a traceable signature in the distribution — and a well-equipped laboratory can read that signature like a logbook.
When the sieve shaker becomes a diagnostic tool
Process evaluation, not just size measurement
The sieve shaker isn't only for raw material acceptance. It's a diagnostic probe into the health of your entire line:
- After drying: Has spray drying generated agglomerates outside the acceptable range?
- After milling: Is the new pin mill producing a wider distribution than the old fluidized-bed jet mill?
- After transportation: Did vibrations during bulk shipment segregate fines to the bottom of the IBC?
Each condition change leaves a characteristic fingerprint in the distribution curve. By making sieving a routine surveillance procedure — not a crisis response — you build a process baseline that turns outliers into early warnings.
Recognizing the human factor
Operators often compensate for poor powder behavior by adjusting machine settings: higher compression force, slower speed, more lubricant. These compensations hide the root cause and create fragile processes that collapse when a second variable shifts. A sieve shaker's report can short-circuit this dangerous drift by redirecting attention to the powder itself: fix the particle, not the press.
Choosing the right tool for the question
Vibratory vs. air-jet sieve shakers
| Feature | Vibratory sieve shaker | Air-jet sieve shaker |
|---|---|---|
| Separation mechanism | Mechanical vibration across stacked sieves | Compressed air lifts particles through a single sieve |
| Typical sample mass | 50–500g | 10–100g |
| Best for | Bulk distribution analysis, multi-fraction collection | Fine, cohesive, or static-prone powders |
| Sieve blinding risk | Moderate (periodic cleaning required) | Low (continuous air flow clears apertures) |
| Throughput | Higher per run | Single sieve per run, but faster per fraction |
Both have their place. A laboratory developing formulations may prefer a vibratory unit with full stack capability for efficient fractionation and bulk property testing. A quality control lab checking incoming excipients against a single D-value specification may find an air-jet system faster and less prone to operator variance.
The bigger picture: integration with pressing and forming
The true power of particle size control emerges when size data directly informs downstream processing. A vibratory sieve shaker's D50 and distribution width guide:
- Die filling parameters on automated presses — how fast the shoe moves, whether vibration assist is needed
- Packing pressure profiles for cold isostatic pressing — the relationship between green density and particle packing
- Sintering temperature curves — where a narrow distribution enables a steeper thermal ramp without cracking
Without upstream size characterization, downstream equipment operates on assumptions. Assumptions are expensive.
The romantic engineer's checklist
The writer Atul Gawande would recognize this pattern: a simple, disciplined practice — in surgery, a hand wash; in powder processing, a sieving protocol — prevents the complex catastrophes that capture headlines. Engineers who treat particle size analysis as routine maintenance rather than a troubleshooting tool sleep better. Their processes don't drift.
A pragmatic checklist for the lab:
- Establish baseline distributions for every new material lot
- Sieve after every process change — new mill, new dryer, new supplier
- Correlate D50 and fines percentage with critical quality attributes
- Automate data logging to spot trends before the press operator does
- Validate sieve integrity monthly — mesh wear changes aperture size silently
The best equipment in the world won't save a process that refuses to measure what matters. But when the measurement habit exists, the right instruments transform it from a chore into a strategic asset.
The quiet variable, mastered
Particle size is silent because microns don't register on human senses. But its fingerprints are everywhere: in the tablet that cracks, the ceramic that warps, the battery electrode that delaminates. The vibratory sieve shaker, embedded in a complete sample preparation workflow — from crushers and mills to mixers and isostatic presses — turns an invisible variable into a visible, manageable, and optimizable force.
That is the engineer's romance: not the flash of breakthrough, but the quiet satisfaction of a process so well-understood that it barely makes noise. The powder flows, the tablets hold, the yield holds steady, and somewhere in the lab, a sieve stack just finished its run — right on time, right on specification.
Ready to turn particle size from a hidden liability into your most reliable control lever? Contact Our Experts
Quick Links
Suggested Products
Vibratory Sieve Shaker Electromagnetic 3D Motion Powder Particle Size Analyzer for Dry and Wet Sieving Laboratory Dry and Wet Three Dimensional Vibratory Sieve Shaker for Particle Analysis Stainless Steel Laboratory Vibratory Test Sieve Shaker Heavy Duty Dry Three Dimensional Vibratory Sieve Shaker for Particle Separation Dry Three Dimensional Vibratory Sieve ShakerFurther Reading
The 75-Micron Mystery: How the Humble Sieve Decides Whether Your Brick Becomes a Wall or Returns to Dust The Sieve Never Lies: How a Simple Stack of Mesh Became the Lab’s Ultimate Truth-Teller The Hidden Geometry of Grain: What Multi-Dimensional Sieving Reveals About Process, Nutrition, and Consistency The Hidden Geometry of Biomass Carbonization: Why Particle Size Uniformity Determines Your Material’s Destiny The Dance of Sharp Angles: Why the Chaos of a Vibrating Sieve Is the Only Thing That Makes Sense for Black Silicon CarbidePowderPreparation
Last updated on May 15, 2026
Related Products
Vibratory Sieve Shaker Electromagnetic 3D Motion Powder Particle Size Analyzer for Dry and Wet Sieving
Laboratory Dry and Wet Three Dimensional Vibratory Sieve Shaker for Particle Analysis
Stainless Steel Laboratory Vibratory Test Sieve Shaker
Heavy Duty Dry Three Dimensional Vibratory Sieve Shaker for Particle Separation
Dry Three Dimensional Vibratory Sieve Shaker
Small Laboratory Vibratory Sieve Shaker for Powder Gradation and Particle Size Analysis
High Frequency Wet Three-Dimensional Vibrating Sieve Shaker for Dry and Wet Particle Size Analysis
Small Laboratory Vibrating Sieve Shaker for Precise Particle Size Analysis
High Frequency Cabinet Type Three-Dimensional Rotary Vibrating Sieve Shaker for Dry Sieving and Particle Classification
Laboratory Vibratory Test Sieve Shaker for Precision Particle Size Analysis and Powder Grading
三维电磁微量振动筛分仪
Tapping Oscillating Sieve Shaker for Dry and Wet Particle Size Analysis
Stainless Steel Rotary Vibrating Sieve High Precision Circular Vibratory Separator Industrial Powder Grading Machine Multi Layer Sifting Equipment
Three Dimensional Rotary Vibrating Sieve
Small Vibrating Ultrafine Grinder for Traditional Chinese Medicine
Automatic Vibrating Powder Feeder for Laboratory Material Processing Precision Vibratory Hopper Feeder for Granular and Powder Material Handling Industrial Grade Vibrating Tray Feeder for Consistent Material Sample Preparation
Vibratory Superfine Grinder for Ultra Fine Laboratory Powder Milling
Vibratory Disc Mill for Rapid Fine Grinding and High Throughput Sample Preparation of Hard and Brittle Materials