The Half-Millimeter Frontier: Why Particle Size Is the Hidden Variable Sabotaging Your Starch Analysis
Jul 10, 2026
The Scenario That Keeps Analytical Chemists Awake
A shipment of corn arrives. Two technicians pull samples from the same batch. One reports a starch content of 71.2%. The other reports 68.7%.
The spread exceeds the method’s stated reproducibility limit. The data is useless. The panic starts.
Most people look at the reagents first—was the enzyme expired? Did the pipette drift out of calibration? But that’s the classic psychological trap we fall into. We trust our eyes, and our eyes tell us the sample is already a powder. It went through a 1 mm mill. It looks uniform. It feels uniform.
It is not uniform.
The real culprit? A failure to cross the half-millimeter frontier.
The Physics of Hiding in Plain Sight
In analytical chemistry, we worship the liquid phase. Liquids mix perfectly; pipetting is elegant. But grain analysis begins its life harshly in the solid phase, a realm where geometry trumps chemistry.
A corn kernel isn’t a homogenous sphere of starch. Under a microscope, it’s a fortress.
The Fortress Analogy
Imagine the starch molecule as a piece of artillery surrounded by concentric walls.
- The Outer Wall: The pericarp (the hull). Fibrous, hydrophobic, chemically resistant.
- The Middle Bulwark: The aleurone layer and protein matrix. A sticky, cross-linked net that physically cages the starch granules.
- The Inner Keep: The starch granule itself, semi-crystalline and tightly packed.
If your first grind simply shatters the kernel into 1 mm fragments, you’ve merely turned a fortress into rubble. You have broken the outer wall, but the inner keep remains intact. The enzyme in your assay kit is a biochemically specific key, but it can’t unlock a door buried under mounds of protein debris.
The solution isn’t more chemistry. It’s more physics. You have to pulverize the debris until the keep itself is exposed. That requires a secondary grind with a 0.5 mm sieve.
The Hidden Variable: Why "Fine" Is a Subjective Term
There’s a psychological bias in sample preparation we rarely talk about: the "goldilocks" delusion. We think our grinding method creates particles that are "just right" for digestion.
But particle size isn’t a number; it’s a distribution curve. A 1 mm screen doesn’t give you 1 mm particles. It gives you a chaotic bell curve spanning from chunky 1 mm shards down to dust. When you pipette a subsample for the assay, you are rolling the dice on that curve.
The Reactive Surface Area Problem
Enzyme kinetics are a surface phenomenon. A starch molecule buried 500 microns deep inside a particle is effectively invisible to the enzyme until the outer layers dissolve. By forcing the sample through a 0.5 mm micro-hole sieve, you aren't just making the particles smaller; you are linearizing the digestion reaction.
Consider the math:
- A single 1 mm particle has a certain volume (V) and surface area (S).
- Break that particle into fragments that pass a 0.5 mm sieve.
- You haven't changed the mass. You haven't changed the total starch.
- But you have exponentially increased the S/V ratio.
With secondary grinding, the lag phase of enzymatic hydrolysis disappears. You don’t just get a higher result; you get a result that reflects the total starch, not just the easily accessible starch.
The Sieve as a Statistical Gatekeeper
We often view sieves as tools for "size reduction." But for the high-precision lab, the sieve’s real function is statistical standardization.
Turbulent milling produces a Gaussian distribution of fragments. If you run that heterogeneous mix directly into an assay, you’re measuring the reactivity of a chaotic physical system, not the chemistry of the grain.
Narrowing the Band of Chaos
The 0.5 mm sieve acts as a gatekeeper. It rejects the "abnormal" fragments that skew your standard deviation. By using a specific micro-sieve, you truncate the distribution.
You are effectively telling the sample: "You will not enter this analytical reaction until you meet a specific physical profile."
This is the philosophical difference between a rough assay and a defensible result. The defensible result is one where you have explicitly stated, documented, and enforced the physical state of the matter before you asked it a chemical question.
The Thermal Trap: When Speed Becomes the Enemy
Here is where the engineer’s romance meets harsh reality. The ultimate goal is a 0.5 mm powder, but the path there is paved with friction.
High-speed rotor mills and pulverizers are the standard tool for this task. They are brutally efficient. But efficiency generates entropy. The frictional heat inside the grinding chamber can spike rapidly.
The Chemistry of Heat Damage
Starch isn't inert. When the temperature inside a pulverizer climbs too high:
- Gelatinization: The semi-crystalline structure of the starch granule begins to melt. It becomes amorphous, forming a sticky film on the interior of the mill.
- Retrogradation: If moisture is present, the melted starch can recrystallize upon cooling into a form highly resistant to enzymatic digestion (resistant starch).
You grind the sample to a perfect 0.5 mm, but you’ve thermally modified the analyte before the analysis even begins. You’ve traded a particle size error for a structural chemistry error.
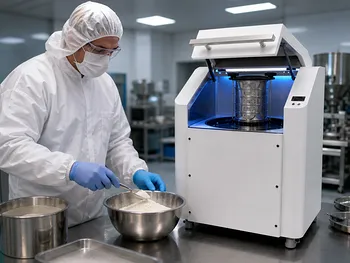
The Mitigation Strategy: For heat-labile grains like barley, high-speed grinding isn't just a mechanical process; it's a thermal management problem. The solution is not to slow down the blade, but to sink the heat. This is where liquid nitrogen cryogenic grinders become indispensable. By embrittling the grain and sinking the frictional energy into evaporation, the cryogenic process preserves the native starch structure while effortlessly achieving the sub-micron particle range.
The Dust Dilemma: Mass Balance and Fines Loss
There is a second trade-off. The 0.5 mm frontier produces dust—ultra-fine particulates that want to aerosolize the moment you open the chamber.
If you lose 2% of the sample as airborne dust, did you really grind the sample? Or did you just fractionate it?
In cereals, the "fines" (the dust) are often disproportionately composed of the starchy endosperm because it pulverizes easier than the tough fiber. If the dust drifts away, your recovered sample is artificially enriched in fiber and protein. The total starch analysis will be a dramatic under-estimation, not because the chemistry failed, but because you lost the analyte to the ventilation system.
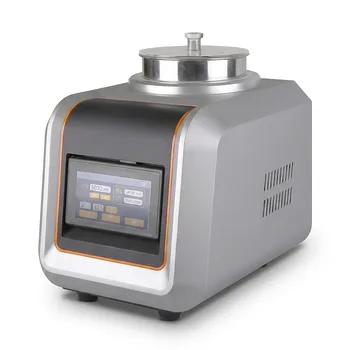
The Systematic Fix: The tool must be a closed system. It's not just about a lid; it's about a sealed grinding path—cassette to rotor, rotor to collection vessel. Enclosed pulverizers and sieving systems (like a closed-loop air-jet sieve) ensure that the sample mass inside the chamber at the end equals the mass you started with. The ultra-fines stay in the sample bag, right where they belong.
Engineering Your Protocol: A Decision Architecture
Preparing corn and barley for enzymatic starch digestion isn't a one-size-fits-all process. It's a deliberate decision depending on your tolerance for error and the fragility of your sample.
Break down the workflow not as a recipe, but as a risk-management architecture:
1. The "Maximum Precision" Path
Your Goal: Absolute truth in total starch. The Protocol: Direct attack.
- Take the pre-milled sample (1 mm or 2 mm rough grind).
- Feed directly into a high-speed rotor mill or a planetary ball mill fitted with a 0.5 mm retention sieve.
- Non-negotiable: Ensure the chamber is either cooled or that the run time is short enough to prevent heat build-up. For corn, watch the temperature; for high-oil barley, watch for smearing on the sieve.
2. The "Equipment Longevity" Path
Your Goal: Defend the hardware from abuse while maintaining data integrity. The Protocol: Staged reduction.
- Pre-Screen: Use a larger 4.75 mm sieve (or a jaw crusher) to scalp the coarse fragments and rogue foreign objects that love to destroy expensive ring sieves.
- Secondary Grind: Move the "pre-screened" fraction to the 0.5 mm mill.
- This two-stage approach reduces the maintenance frequency on your precision micro-sieves, ensuring the 0.5 mm barrier remains geometrically true over years of service.
3. The "Multi-Parameter" Path
Your Goal: One sample prep run for starch, moisture, and bulk density. The Protocol: The 40-mesh sweet spot.
- In the world of sample prep, a 0.5 mm micro-hole sieve is the physical equivalent of a 35-40 mesh.
- This fineness is the universal compromise. It is sufficiently fine to give quantitative starch digestion, yet it doesn't expose the sample to the atmosphere so much that moisture equilibration happens instantly (though you must move fast).
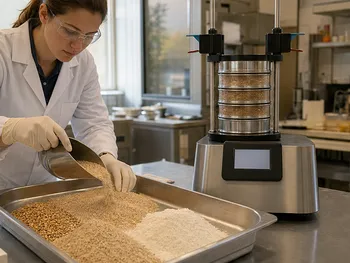
- Using a vibratory sieve shaker right after the secondary grind allows you to verify the particle distribution before splitting the sample for the three distinct tests.
The Toolbox: Beyond the Single Mill
The industry loves the "hero" instrument—the one machine that does it all. But the physics of particle size distribution tells us that the "hero" is actually a system.
Grinding and sieving are partners. One randomizes the size; the other imposes order. You cannot achieve the 0.5 mm standard reliably without integrating both.
The System Architecture
| The Stage | The Engineering Goal | The Equipment |
|---|---|---|
| Coarse Crushing | Reduce whole grains to manageable fragments without thermal shock. | Jaw crushers or roll crushers. |
| Fine Grinding | Force the material through the 0.5 mm frontier; fracture the protein matrix. | Rotor mills, planetary ball mills, or (for heat-sensitive starch) liquid nitrogen cryogenic grinders. |
| Validation & Classification | Refuse to guess; prove that >95% of the mass passed the barrier. | Air-jet sieves or vibratory sieve shakers with certified 0.5 mm test sieves. |
| Homogenization | Reintegrate the classified fines into a single, blendable entity. | Lab powder mixers. |
The Cryogenic Escape Hatch
For the corn sample rich in oil or the barley sample harvested slightly damp, the friction of a standard mill is a non-starter. It will smear, not grind. It is here that the liquid nitrogen cryogenic grinder becomes the linchpin of sample integrity. The liquid nitrogen doesn't just cool the sample; it physically hardens the protein matrix, making it fracture cleanly alongside the starch.
You aren't "cutting" anymore. You're fracturing glass. The result is a crisp, narrow particle distribution around the 0.5 mm target with zero thermal alteration to the starch molecule. It is the cleanest possible separation of physical preparation from chemical integrity.
The Romance of the Standardized Grain
There is a quiet beauty in a sample that has been brought to perfect homogeneity. When you pour that 0.5 mm barley flour onto the analytical balance, you aren't just weighing a powder; you're holding a solid solution.
You have taken a biological variable—a seed grown in a field, subjected to sun and wind—and transformed it into a physical constant. The chemist can now interrogate the starch with enzymes, not with prayers. The nutritional label printed on the final product becomes a fact, not a guess.
This isn't just grinding. This is the meticulous engineering of the surface on which chemistry will happen.
If you find your standard deviation drifting, or if your inter-lab proficiency tests come back with z-scores that make you wince, stop looking at the wet chemistry. Look at the phase boundary. Ask yourself honestly: did you cross the half-millimeter frontier, or did you just pretend to?
Achieving that frontier requires a designed system, not just a motor and a blade. Whether it’s the heat management of a cryogenic grinder, the closed-loop loss prevention of an air-jet sieve, or the brutal consistency of a hydraulic press turning loose powder into a stable pellet for XRF—precision dictates the tools.
Contact Our Experts to configure a sample preparation system that guarantees your sample’s physical state aligns with your analytical standard.
Quick Links
Suggested Products
Stainless Steel Rotary Vibrating Sieve High Precision Circular Vibratory Separator Industrial Powder Grading Machine Multi Layer Sifting Equipment Small Laboratory Vibratory Sieve Shaker for Powder Gradation and Particle Size Analysis Laboratory Air Jet Sieving Machine for Fine Powder Particle Size Analysis and DeagglomerationFurther Reading
The 0.5mm Gateway: Why Bulk Density Is a Measure of Flow, Not Just Weight The 0.033-Inch Gatekeeper: What a Precision Sieve Teaches Us About Life-Saving Powders The Sieve Deception: How Blind Trust in Mesh Numbers Ruins Black Silicon Carbide Performance The Hidden Geometry of Grain: What Multi-Dimensional Sieving Reveals About Process, Nutrition, and Consistency The Great Unblinding: How a Simple Sieve Unlocks the Hidden Fortunes in Electronic Waste
PowderPreparation
Last updated on May 14, 2026
Related Products
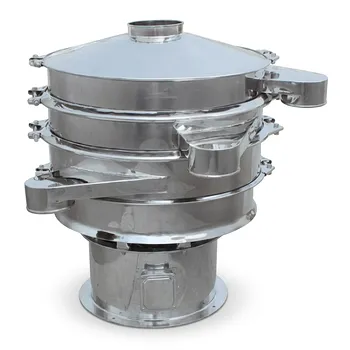
Stainless Steel Rotary Vibrating Sieve High Precision Circular Vibratory Separator Industrial Powder Grading Machine Multi Layer Sifting Equipment
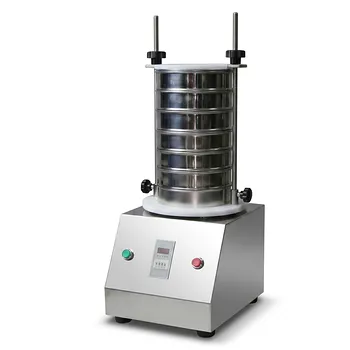
Small Laboratory Vibratory Sieve Shaker for Powder Gradation and Particle Size Analysis